0. Introduction
In probability and statistics, we often care less about the value of a random quantity itself than about how far it can deviate from its typical value.
As an example, consider the sample mean
of independent and identically distributed (i.i.d.) random variables . If , the law of large numbers states that converges to the expectation with probability as . In real data analysis, however, is finite. What we want to know is how small the following probability is for a given and :
Inequalities that bound this probability from above in terms of , , and properties of the distribution (such as its range or variance) are called concentration inequalities.
The central limit theorem also describes the fluctuations of , but it states the shape of the distribution in the limit and says nothing about the size of the error at a finite . Concentration inequalities give bounds that hold as they are at a finite .
Running example: estimating a success probability
Throughout this article, we compare the inequalities on the following problem.
We run independent trials, each succeeding with probability , and set if the -th trial succeeds and otherwise. When we estimate by the success rate , how large must be for the probability of an error of or more to be at most ?
We use the following two settings, each with and :
- (A) , : the variance of one trial, , takes its maximum value .
- (B) , : successes are rare, and the variance is small.
First, we examine the distribution of in setting (A) with Python. The following code generates times for each of and plots histograms.
import numpy as np
import matplotlib.pyplot as plt

rng = np.random.default_rng(0)
p, eps, trials = 0.5, 0.05, 100_000

for n in [10, 100, 1000]:
    # Success rates of n trials with success probability p, repeated trials times
    p_hat = rng.binomial(n, p, size=trials) / n
    # Fraction with an error of eps or more (1e-12 guards against rounding errors)
    miss = np.mean(np.abs(p_hat - p) >= eps - 1e-12)
    bins = (np.arange(n + 2) - 0.5) / n  # bins of width 1/n centered at k/n
    plt.hist(p_hat, bins=bins, density=True, histtype="step", lw=2,
             label=f"$n = {n}$ ({miss:.3f})")

plt.axvspan(p - eps, p + eps, color="gray", alpha=0.2)
plt.xlim(0.2, 0.8)
plt.xlabel(r"$\hat p$")
plt.ylabel("Density")
plt.legend(loc="upper left")
plt.show()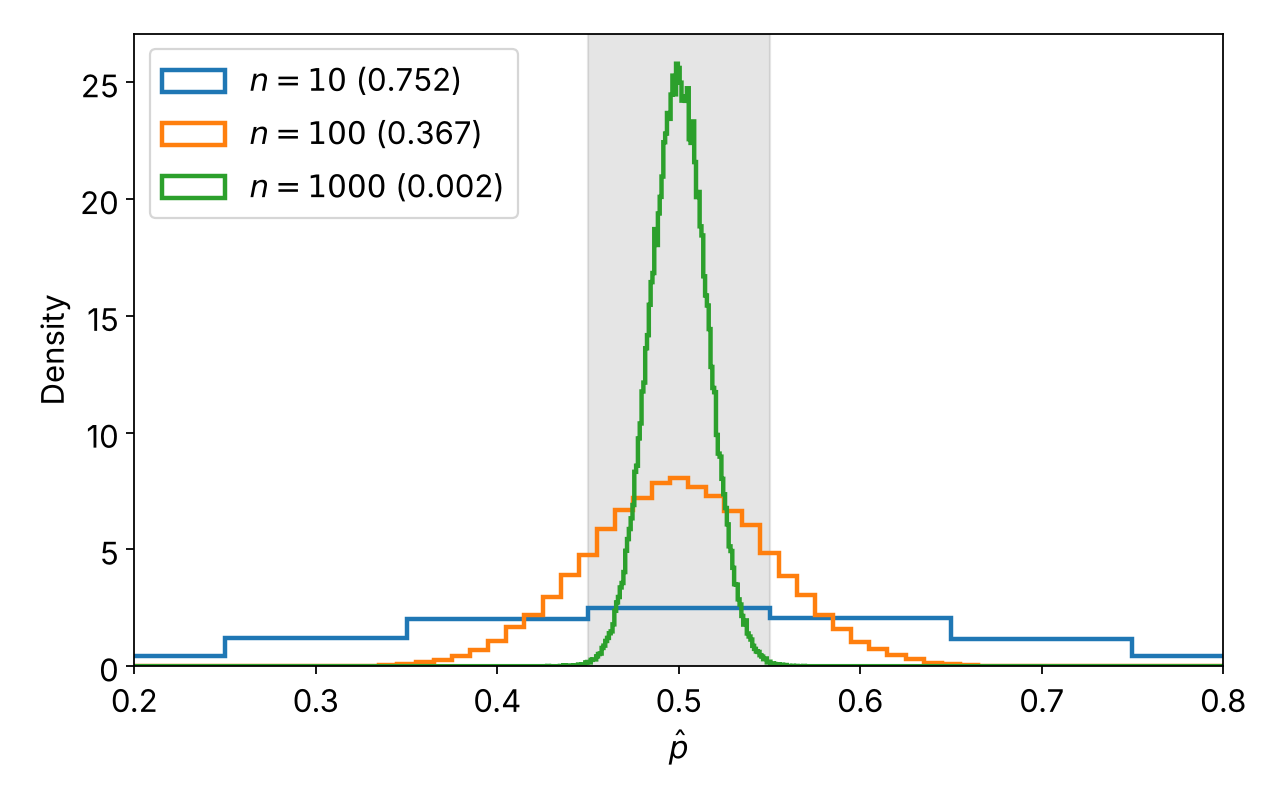
As Figure 1 shows, the distribution of concentrates around as grows, and the fraction of runs with an error of or more drops from at to at and at . Concentration inequalities give upper bounds on this fraction without computing the distribution in detail.
All figures in this article, including Figures 2 and 5 whose code is not shown here, can be regenerated with code/concentration/make_figures.py.
Roadmap
The inequalities covered in each section and the information each one uses are as follows:
- Markov's inequality (Section 2): nonnegativity and the expectation
- Chebyshev's inequality (Section 3): the variance
- The Chernoff method (Section 4): the moment generating function
- Hoeffding's inequality (Section 5): independence and the range
- Bernstein's inequality (Section 6): independence, the range, and the variance
- McDiarmid's inequality (Section 7): independence and a bound on how much the output changes when one input changes
Section 8 compares the results for the running example, and Section 9 introduces tools for cases where the assumptions fail. An inequality in a later section is not always stronger than one in an earlier section. Which inequality gives the smallest bound depends on the available assumptions and the conditions of the problem.
1. Notation and basics
- denotes the probability of an event , the expectation of a random variable , and its variance.
- is the indicator function of an event : it equals if occurs and otherwise.
- " a.s." means that holds with probability (almost surely).
- For random variables , we write their sum as and their sample mean as .
- denotes the natural logarithm.
Tail probabilities and the union bound
The probability that a random variable deviates from its expectation by or more is called a tail probability. Depending on the direction of the deviation, there are three kinds:
- Upper tail probability:
- Lower tail probability:
- Two-sided tail probability:
Concentration inequalities give upper bounds on these tail probabilities (tail bounds). Because holds for any events and (the union bound), the two-sided tail probability is at most the sum of the upper and lower tail bounds. Therefore, when the same bound holds for both the upper and the lower tail, the two-sided bound has a factor of .
2. Markov's inequality
Markov's inequality bounds a tail probability using only nonnegativity and the expectation. Every other inequality in this article uses it somewhere in its proof.
Suppose that a.s. and . Then, for any ,
Proof. Because a.s., the inequality holds with probability (the right-hand side is when and otherwise). Taking expectations of both sides gives , and dividing by gives Theorem 1.
Setting with gives . For example, the probability that a nonnegative random variable is at least times its expectation is at most . In exchange for the weak assumptions, the bound decreases only as .
Bounding the indicator function with nonnegative functions
The proof bounds the indicator function from above by a nonnegative function and takes the expectation. In general, if a random variable and a nonnegative function satisfy for every value that can take, then
Different choices of give different inequalities (Figure 2).
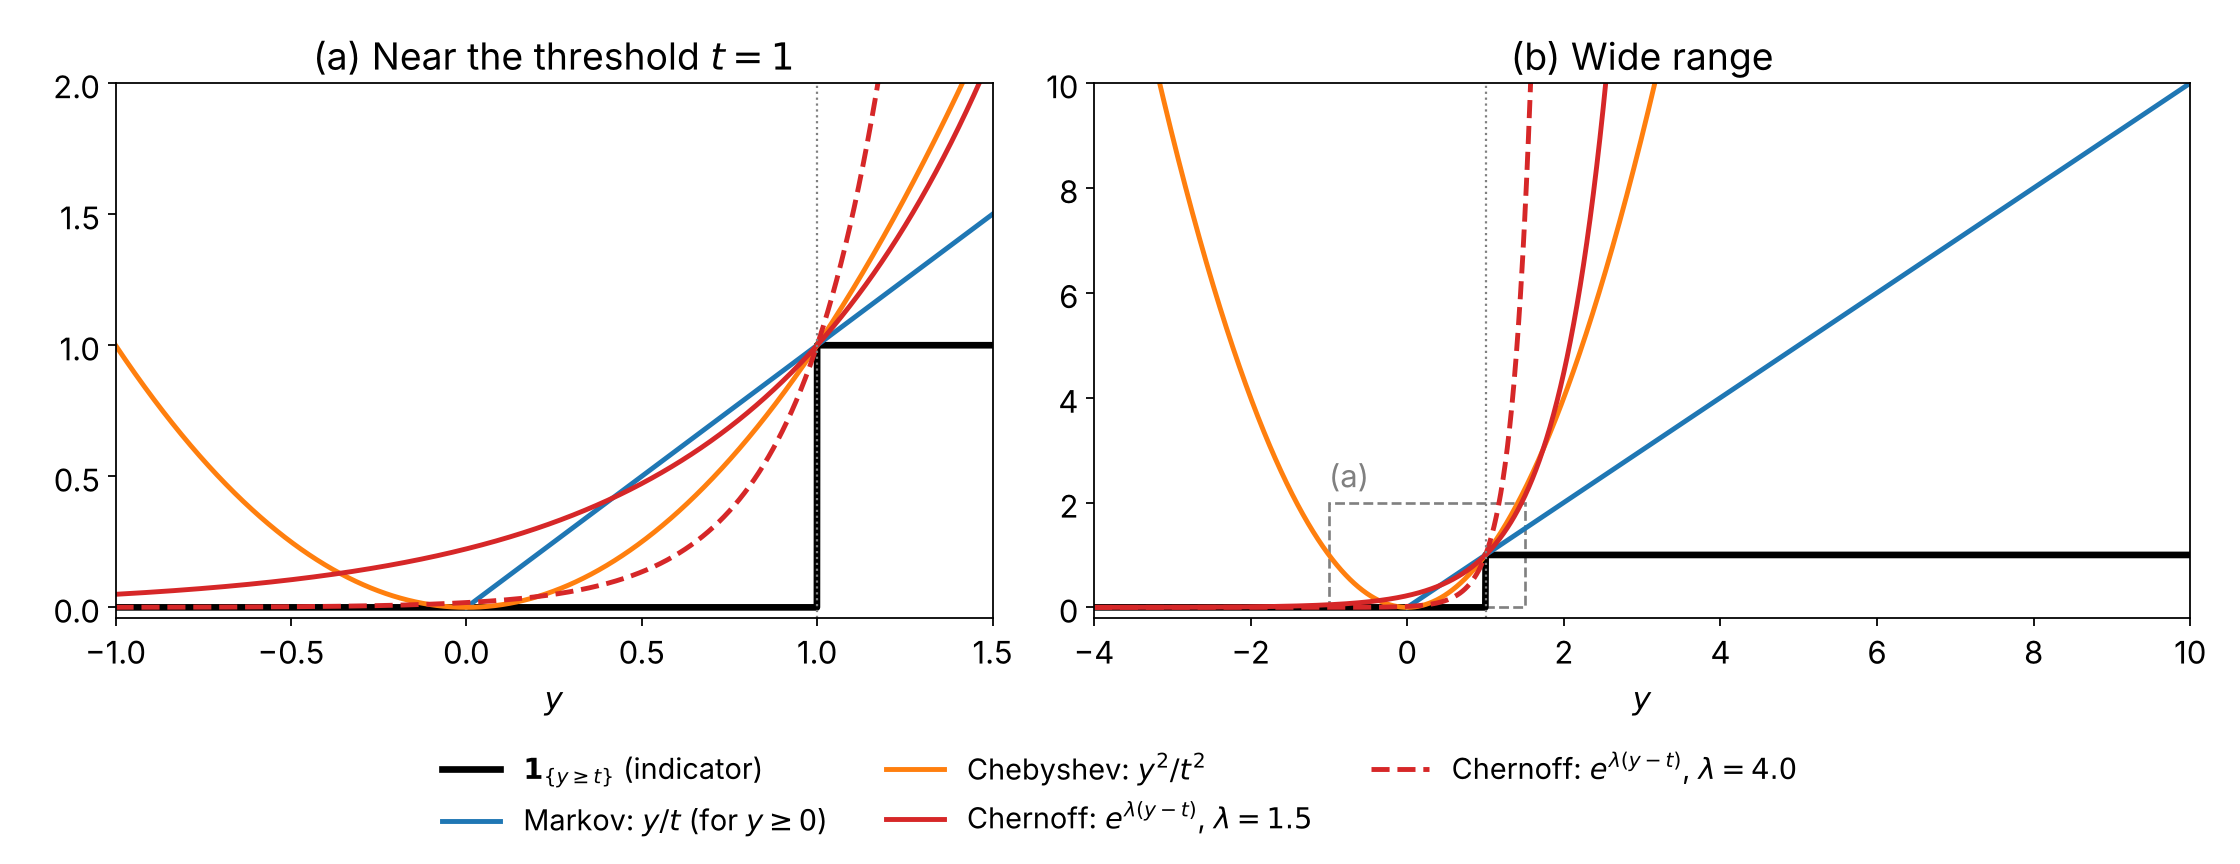
- Markov's inequality (Section 2) uses with a nonnegative .
- Chebyshev's inequality (Section 3) uses with . This is also at least for , so it bounds the two-sided tail probability at once.
- The Chernoff method (Section 4) uses with and .
The closer is to the indicator function where is likely to take values, the smaller the bound. In the Chernoff method, controls the shape of . Near in Figure 2(a), the curve for is closer to the indicator function for than the curve for , but it grows faster for . Section 4 optimizes this .
The wide range in Figure 2(b) shows how differently the functions grow far from . Markov's is linear in , and Chebyshev's grows in both directions away from . The Chernoff function approaches as decreases but grows exponentially for . Therefore, for to be finite in the Chernoff method, the moment generating function of (Section 4) must be finite; that is, the upper tail of must decay at least exponentially fast.
3. Chebyshev's inequality
Chebyshev's inequality uses the variance to bound how far a random variable deviates from its expectation.
Suppose that the variance of is finite. Then, for any ,
Proof. Applying Markov's inequality to the nonnegative random variable gives
Application to the sample mean
Suppose that are pairwise uncorrelated with a common expectation and a common variance . Then , and Theorem 2 gives
The calculation of uses only the additivity of variance, so uncorrelatedness, which is weaker than independence, is enough.
Running example. The variance of one trial is , so the right-hand side is at most if
In setting (A) with , this gives . Because the required is proportional to , it becomes for .
4. The Chernoff method
The bound from Chebyshev's inequality decreases only polynomially in . Using an exponential function gives bounds that decrease exponentially in . This technique is called the Chernoff method or the Cramér–Chernoff method (Chernoff, 1952; Boucheron et al., 2013, §2.2).
General form
The function of is called the moment generating function (MGF) of . In this article, we use the logarithm of the MGF of the centered random variable:
If is finite for , then, because is increasing, Markov's inequality gives
Because this holds for every with , minimizing the right-hand side over gives
This bound is called the Chernoff bound. Any upper bound on turns it into a concrete bound. The lower tail probability is bounded by applying the same argument to .
Sums of independent random variables
With the exponential function, the MGF of a sum of independent random variables factors into the product of their MGFs. If are independent, then
and taking logarithms gives . Therefore, bounds on each give a bound on the tail probability of the sum . Hoeffding's inequality in Section 5 and Bernstein's inequality in Section 6 are derived in this way.
Sub-Gaussian random variables
A random variable is sub-Gaussian with variance parameter if, for all ,
For a normal random variable with variance , holds with equality. In other words, a sub-Gaussian random variable is one whose centered MGF is at most that of a normal distribution. For a sub-Gaussian , the function attains its maximum at , so the Chernoff method gives
Because the definition also covers , the same bound holds for the lower tail, and the two-sided bound has a factor of (Boucheron et al., 2013, §2.3).
In addition, if independent are sub-Gaussian with variance parameters , then implies that is sub-Gaussian with variance parameter . Section 5 uses this property to derive Hoeffding's inequality.
A relative-error bound for sums of Bernoulli random variables
Applying the Chernoff method to sums of Bernoulli random variables gives a bound on the error relative to the expectation (Mitzenmacher & Upfal, 2017, Chapter 4).
Let be independent random variables with and . With , for any ,
In addition, for ,
The second inequality in the first display follows from , which holds for . This theorem measures the error by its ratio to the expectation . When is small compared with , it can give a smaller bound than Hoeffding's inequality in Section 5 (see Section 8).
Running example. If , then . The event is the event that a relative error of occurs upward or downward. When , the lower-tail exponent is at least the upper-tail exponent , so combining both tails gives
The right-hand side is at most if ; in setting (B) () with , this gives .
5. Hoeffding's inequality
When independent random variables take values in known bounded intervals, the Chernoff method yields Hoeffding's inequality (Hoeffding, 1963). The key is the following lemma, which shows that bounded random variables are sub-Gaussian.
If a.s., then, for all ,
That is, is sub-Gaussian with variance parameter .
For a proof, see Chapter 2 of Boucheron et al. (2013).
Let be independent random variables with a.s. for each . Then, for any ,
The same bound holds for the lower tail, and the two-sided bound is twice the right-hand side.
Proof. By Hoeffding's lemma, each is sub-Gaussian with variance parameter . As shown in Section 4, the independent sum is sub-Gaussian with variance parameter , so
Sample mean and required sample size
If each a.s. with a common expectation , setting in Theorem 4 gives
For fixed , this bound decreases exponentially in . Chebyshev's bound in Section 3 decreases only as .
Setting the right-hand side to and solving gives two equivalent forms:
- If , then .
- For any , with probability at least , .
Running example. Because , the condition is . In setting (A), this gives for and only for . The required grows in proportion to , so the gap from Chebyshev's inequality, whose grows in proportion to , widens as decreases. In setting (B), however, even requires . Because Hoeffding's inequality uses only the range , it cannot reflect that the variance in (B), , is about of , the maximum variance of a random variable on . Bernstein's inequality in Section 6 addresses this limitation.
The bounds and in Theorem 4 must be known in advance as properties of the distribution. Using the observed minimum and maximum of the sample instead ignores values that have not been observed yet, and the bound is no longer guaranteed.
6. Bernstein's inequality
Hoeffding's inequality uses only the range. For random variables whose values mostly lie near the expectation despite a wide range, Bernstein's inequality, which also uses the variance, gives a smaller bound (Boucheron et al., 2013, §2.8).
Let be independent random variables, and suppose that, for some , a.s. for each . With , for any ,
The same bound holds for the lower tail, and the two-sided bound is twice the right-hand side.
Two rates of decay
How fast the bound decays depends on which of the two terms in the denominator is larger. Because ,
- For , the exponent is at least . Like the tail of a normal distribution with variance , the bound decays with an exponent proportional to .
- For , the exponent is at least . Like the tail of an exponential distribution, the bound decays with an exponent proportional to .
Sample mean and comparison with Hoeffding's inequality
Suppose that are i.i.d. with , , and a.s. Substituting and into Theorem 5 gives
When , the variance is at most . Replacing with this maximum and ignoring gives the exponent , which equals the exponent of Hoeffding's bound in Section 5. In this sense, Hoeffding's inequality is a bound that assumes the largest possible variance. Comparing the two exponents shows that Bernstein's bound is smaller when .
Running example. With and , the condition is
In setting (B) with , this gives , about of Hoeffding's . In setting (A), is already the maximum, so , slightly more than Hoeffding's .
7. McDiarmid's inequality
Sections 5 and 6 dealt with sums of random variables. McDiarmid's inequality, also called the bounded differences inequality, deals with general functions of independent random variables, not only sums (McDiarmid, 1989; Boucheron et al., 2013, §6.1).
A function satisfies the bounded differences condition with constants if, for every and any two points that differ only in the -th input,
The bounded differences condition expresses stability: changing only the -th input changes the output by at most .
Let be independent random variables, with taking values in . If satisfies the bounded differences condition with constants , then satisfies, for any ,
The same bound holds for the lower tail, and the two-sided bound is twice the right-hand side.
Relation to Hoeffding's inequality
Consider the sum with . Changing the -th input changes the sum by at most , so substituting into Theorem 6 gives the same formula as Theorem 4 (Hoeffding's inequality). McDiarmid's inequality extends the assumption of Hoeffding's inequality from "a sum of independent bounded random variables" to "a function that is stable under changes of each input."
Example: uniform deviation of the empirical distribution function
As an example of a function that is not a sum, let be i.i.d. with cumulative distribution function , and consider the largest difference between and the empirical distribution function :
is called the Kolmogorov–Smirnov statistic and is used to test whether a sample follows the distribution . Changing one changes by at most at every , so it also changes the supremum by at most . With , we have , and Theorem 6 gives
The exact distribution of at a finite is not easy to compute, but this bound holds for every .
We check this bound with Python. The following code draws and samples from the uniform distribution (so ) times, computes , and estimates . It uses the mean over the runs as .
import numpy as np
import matplotlib.pyplot as plt

rng = np.random.default_rng(0)
reps = 10_000
s = np.linspace(0, 1.5, 151)  # the horizontal axis is sqrt(n) * t

for n in [100, 1000]:
    # Draw reps samples of size n from Uniform(0, 1) and sort each sample
    u = np.sort(rng.random((reps, n)), axis=1)
    i = np.arange(1, n + 1)
    # Z = sup_x |F_n(x) - x| (largest gap between the empirical CDF and F(x) = x)
    z = np.maximum(i / n - u, u - (i - 1) / n).max(axis=1)
    tail = [np.mean(z - z.mean() >= x / np.sqrt(n)) for x in s]
    plt.semilogy(s, tail, lw=2, label=f"Simulation ($n = {n}$)")

plt.semilogy(s, np.exp(-2 * s**2), "k--", lw=2,
             label=r"McDiarmid bound $e^{-2nt^2}$")
plt.ylim(1e-4, 1.5)
plt.xlabel(r"$\sqrt{n}\,t$")
plt.ylabel(r"$\Pr(Z - \mathbb{E}[Z] \geq t)$")
plt.legend()
plt.show()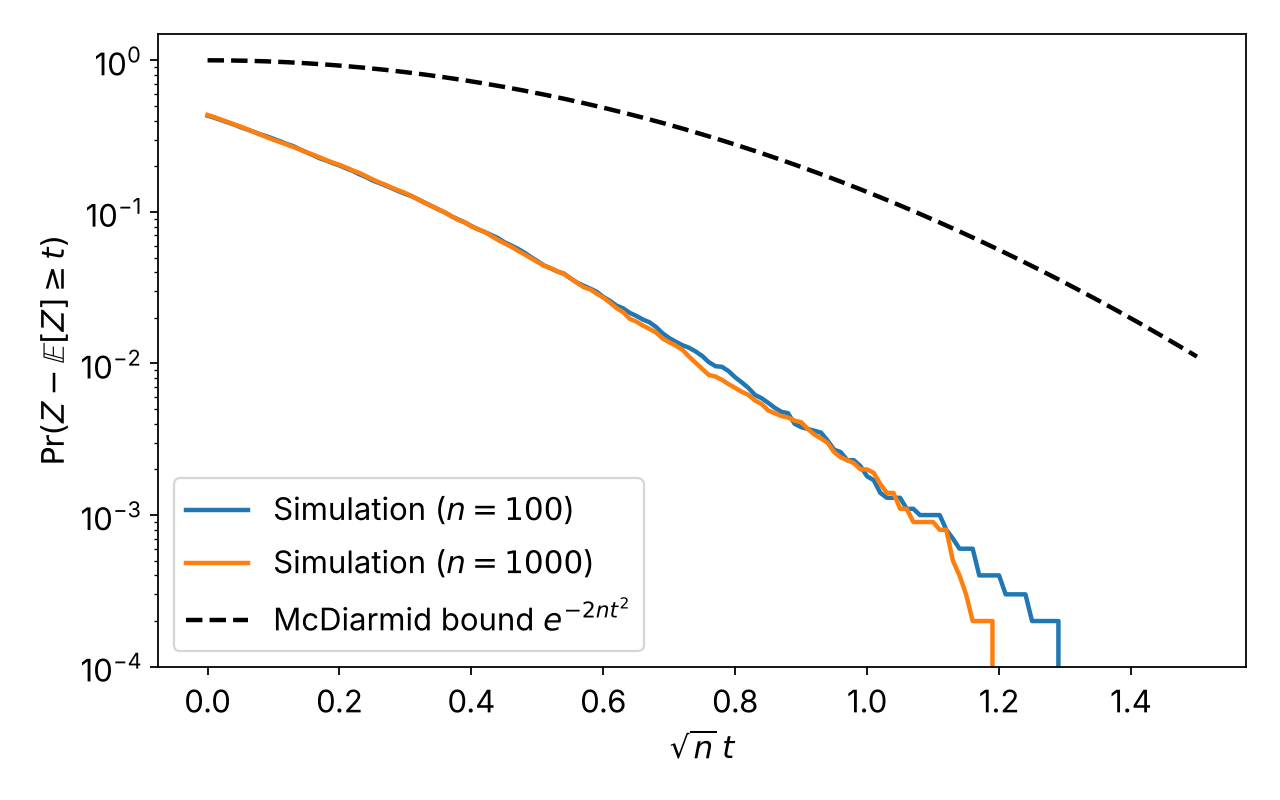
With on the horizontal axis, the bound becomes a single curve that does not depend on . In Figure 3, the simulation results for and almost coincide, and both lie below the bound. In other words, the fluctuations of are of order , and McDiarmid's inequality captures this order correctly.
The same structure appears in machine learning. Let be a set of loss functions with values in , and consider ; the same argument shows the bounded differences condition with . This quantity is the largest gap between the average loss on the training data and the expected loss, and it is used to bound the generalization error. In generalization bounds based on Rademacher complexity, McDiarmid's inequality keeps this quantity close to its expectation, and the expectation is then bounded by the Rademacher complexity (Bartlett & Mendelson, 2002).
McDiarmid's inequality is proved by decomposing into the changes that occur as are revealed one at a time. Let , and for , let
Because ,
Given , the conditional expectation of the increment is . A sequence of random variables with this property is called a martingale.
Moreover, by independence and the bounded differences condition, once are fixed, as a function of takes values in an interval of length at most . Applying Hoeffding's lemma conditionally to each increment and taking conditional expectations for gives
That is, is sub-Gaussian with variance parameter , and applying the Chernoff method as in Section 5 gives Theorem 6.
8. Comparison and choosing an inequality
Results for the running example
Table 1 summarizes the sample sizes derived in Sections 3 to 6 that guarantee . For comparison, it also shows the sample sizes actually required, computed numerically from the binomial distribution. Chebyshev's and Bernstein's inequalities use the true variance . In practice, is unknown, so an upper bound on the variance is used instead (for example, if is known).
Table 1: Lower bounds on the sample size that guarantee
| Inequality | Information used | (A) | (A) | (B) | (B) |
|---|---|---|---|---|---|
| Chebyshev (Section 3) | Variance | 2,000 | 100,000,000 | 7,920 | 396,000,000 |
| Relative-error Chernoff bound (Section 4) | Expectation of a Bernoulli sum | 1,550 | 6,094 | 3,689 | 14,509 |
| Hoeffding (Section 5) | Range | 738 | 2,902 | 73,778 | 290,174 |
| Bernstein (Section 6) | Range, variance | 763 | 2,999 | 3,409 | 13,406 |
| Exact (binomial distribution) | The distribution itself | ≈ 400 | ≈ 2,400 | ≈ 1,600 | ≈ 10,400 |
The last row gives the smallest such that holds for every sample size at or above it. For such that is an integer, the event includes the boundary value with , so the exact probability does not decrease monotonically in . For this reason, the row shows approximate values.
The following code plots the exact from the binomial distribution and the bound from each inequality as functions of .
import numpy as np
import matplotlib.pyplot as plt
from scipy.stats import binom

def exact_tail(n, p, eps):
    """Pr(|S/n - p| >= eps) for S ~ Bin(n, p)"""
    # 1e-9 guards against floating-point rounding errors
    upper = np.ceil(n * (p + eps) - 1e-9)
    lower = np.floor(n * (p - eps) + 1e-9)
    return binom.sf(upper - 1, n, p) + binom.cdf(lower, n, p)

def bounds(n, p, eps):
    """Upper bounds on Pr(|p_hat - p| >= eps) from each inequality"""
    var, M, eta = p * (1 - p), max(p, 1 - p), eps / p
    return {
        "Chebyshev": var / (n * eps**2),
        "Chernoff (relative)": 2 * np.exp(-eta**2 * n * p / (2 + eta)),
        "Hoeffding": 2 * np.exp(-2 * n * eps**2),
        "Bernstein": 2 * np.exp(-n * eps**2 / (2 * (var + M * eps / 3))),
    }

settings = [("A", 0.5, 0.05, 4000), ("B", 0.01, 0.005, 20000)]
fig, axes = plt.subplots(1, 2, figsize=(14, 5.6), sharey=True)
for ax, (label, p, eps, n_max) in zip(axes, settings):
    n = np.arange(10, n_max + 1, 10)
    ax.semilogy(n, exact_tail(n, p, eps), "k", lw=1.2, label="Exact (binomial)")
    for name, value in bounds(n, p, eps).items():
        ax.semilogy(n, np.minimum(value, 1), lw=2.2, label=name)
    ax.axhline(0.05, color="gray", ls="--")
    ax.set(title=rf"({label}) $p = {p}$, $\varepsilon = {eps}$",
           xlabel="$n$", xlim=(0, n_max), ylim=(1e-10, 2))
axes[0].set_ylabel(r"$\Pr(|\hat p - p| \geq \varepsilon)$")
axes[1].legend(loc="lower left")
plt.show()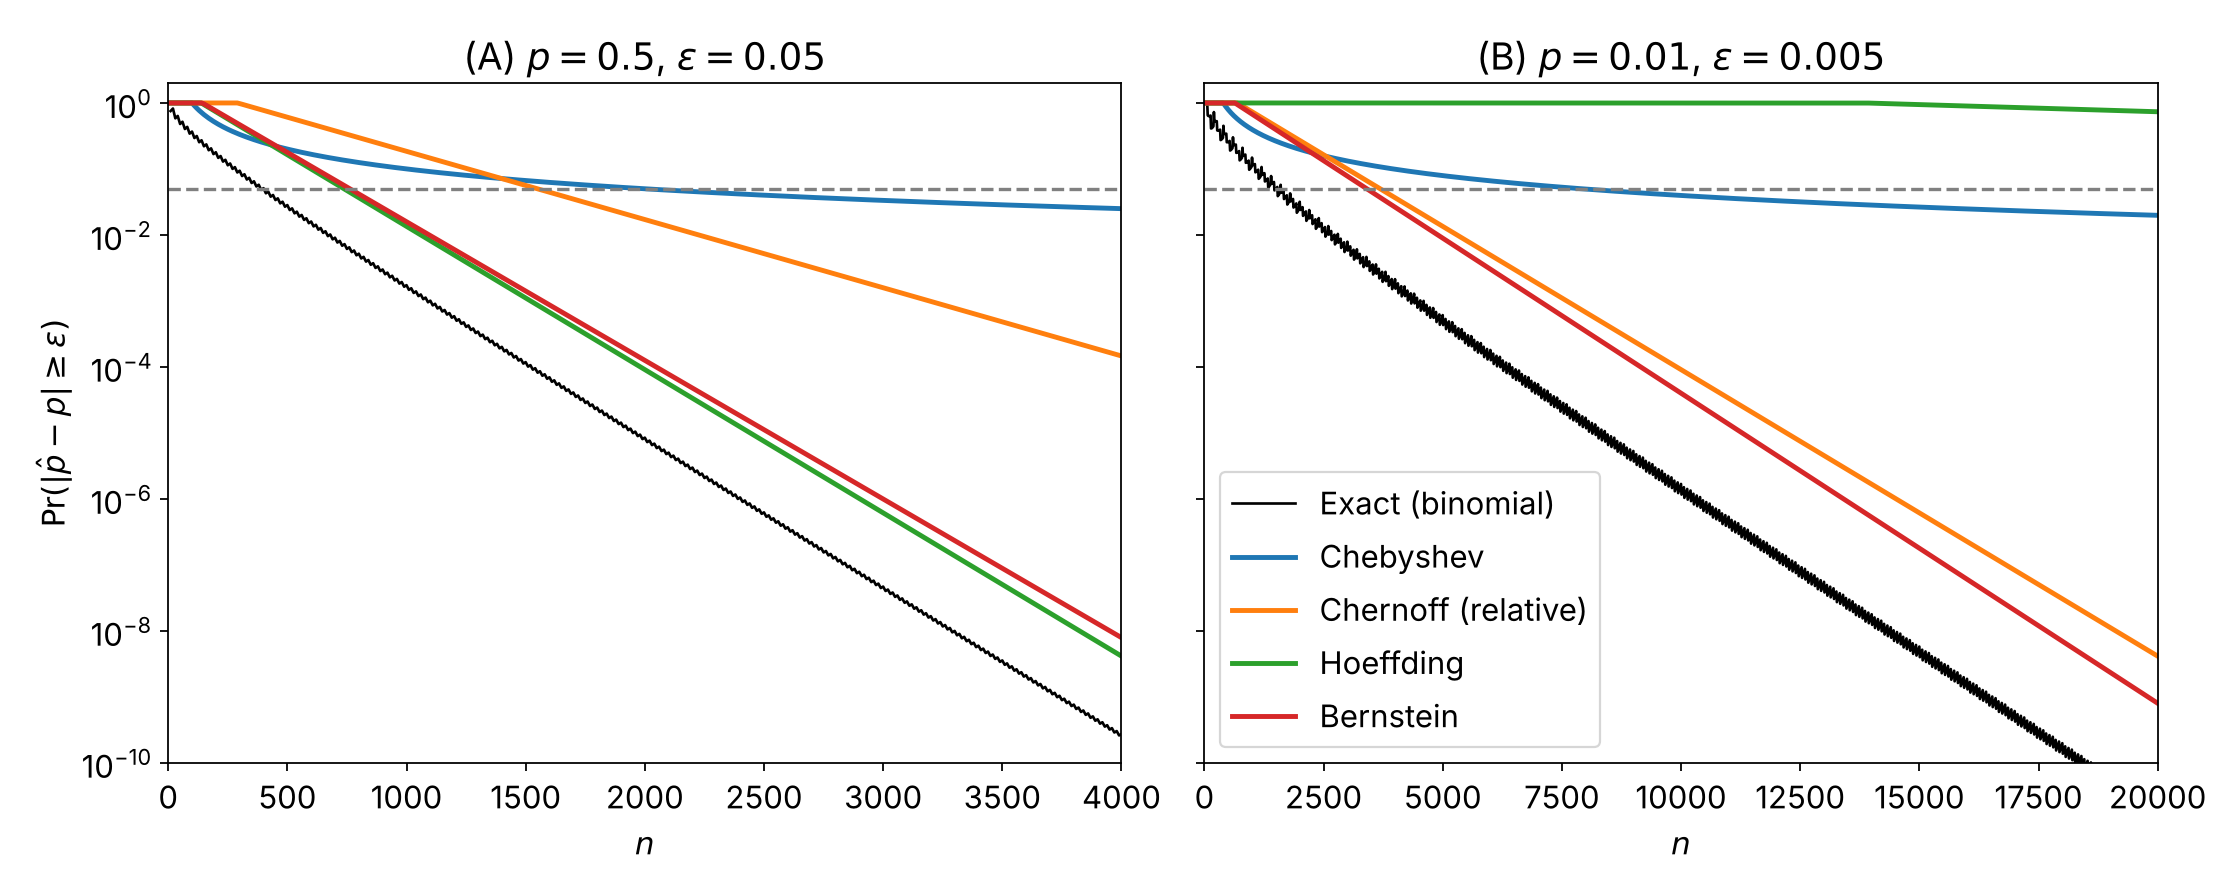
Table 1 and Figure 4 show three points:
- Growth as decreases: Reducing from to multiplies the from Chebyshev's inequality by , because it is proportional to . The from the exponential bounds (Chernoff, Hoeffding, and Bernstein) is proportional to and grows only by a factor of about . In Figure 4, this difference appears as straight lines (exponential decay) versus a flattening curve ( decay).
- Small variance: In setting (B), Bernstein's inequality, which uses the variance, and the Chernoff bound, which uses the error relative to the expectation, give an about times smaller than Hoeffding's inequality, which uses only the range. For , even Chebyshev's inequality gives a smaller than Hoeffding's inequality.
- Conservativeness: Every bound requires more samples than actually needed; even the smallest bound is about – times the exact value in setting (A) and about – times in setting (B). Concentration inequalities do not use the detailed shape of the distribution, and they are conservative to that extent.
Choosing an inequality
Table 2 summarizes the assumptions and bounds of each inequality.
Table 2: Assumptions and bounds of each inequality
| Inequality | Main assumptions | Target | Bound |
|---|---|---|---|
| Markov | Nonnegative, finite expectation | Nonnegative random variable | |
| Chebyshev | Finite variance | Any random variable | |
| Chernoff method | Finite MGF | Any random variable | |
| Hoeffding | Independent, bounded | Sum | |
| Bernstein | Independent, bounded, variance | Sum | |
| McDiarmid | Independent, bounded differences | Function |
The following list gives rough guidelines for choosing an inequality:
- Only nonnegativity and the expectation are known → Markov's inequality
- The variance is known, but independence cannot be assumed → Chebyshev's inequality (it also applies to sample means of uncorrelated variables)
- The MGF can be computed → the Chernoff method directly
- A sum of independent Bernoulli random variables, with the error measured relative to the expectation → the relative-error Chernoff bound
- A sum of independent bounded random variables, with no information on the variance → Hoeffding's inequality
- A sum of independent bounded random variables whose variance is small compared with the range → Bernstein's inequality
- A function that is not a sum, but on which each input has a small effect → McDiarmid's inequality
9. When the assumptions fail
Dependent random variables
Markov's and Chebyshev's inequalities do not require independence. In contrast, Hoeffding's, Bernstein's, and McDiarmid's inequalities in the forms shown in this article assume independence and do not apply as they are to dependent random variables. There are exceptions: Hoeffding (1963) showed that the same bounds as for sampling with replacement also hold for sampling without replacement from a finite population, where the samples are not independent. In addition, the Azuma–Hoeffding inequality applies to martingales with bounded increments (Azuma, 1967). The proof in the column of Section 7 is based on the same martingale argument as this inequality.
Unbounded random variables
Unbounded random variables can also concentrate. For example, a normal distribution is unbounded but, as shown in Section 4, sub-Gaussian. Sub-exponential random variables form a class that contains the sub-Gaussian ones and also allows heavier tails, and Bernstein-type bounds hold for them (Vershynin, 2018, Chapter 2). Even for distributions without a finite MGF, finite higher moments give bounds that decrease polynomially in , by the method of Section 2.
10. Conclusion
As Figure 5 shows, the inequalities in this article follow from Markov's inequality along two paths.
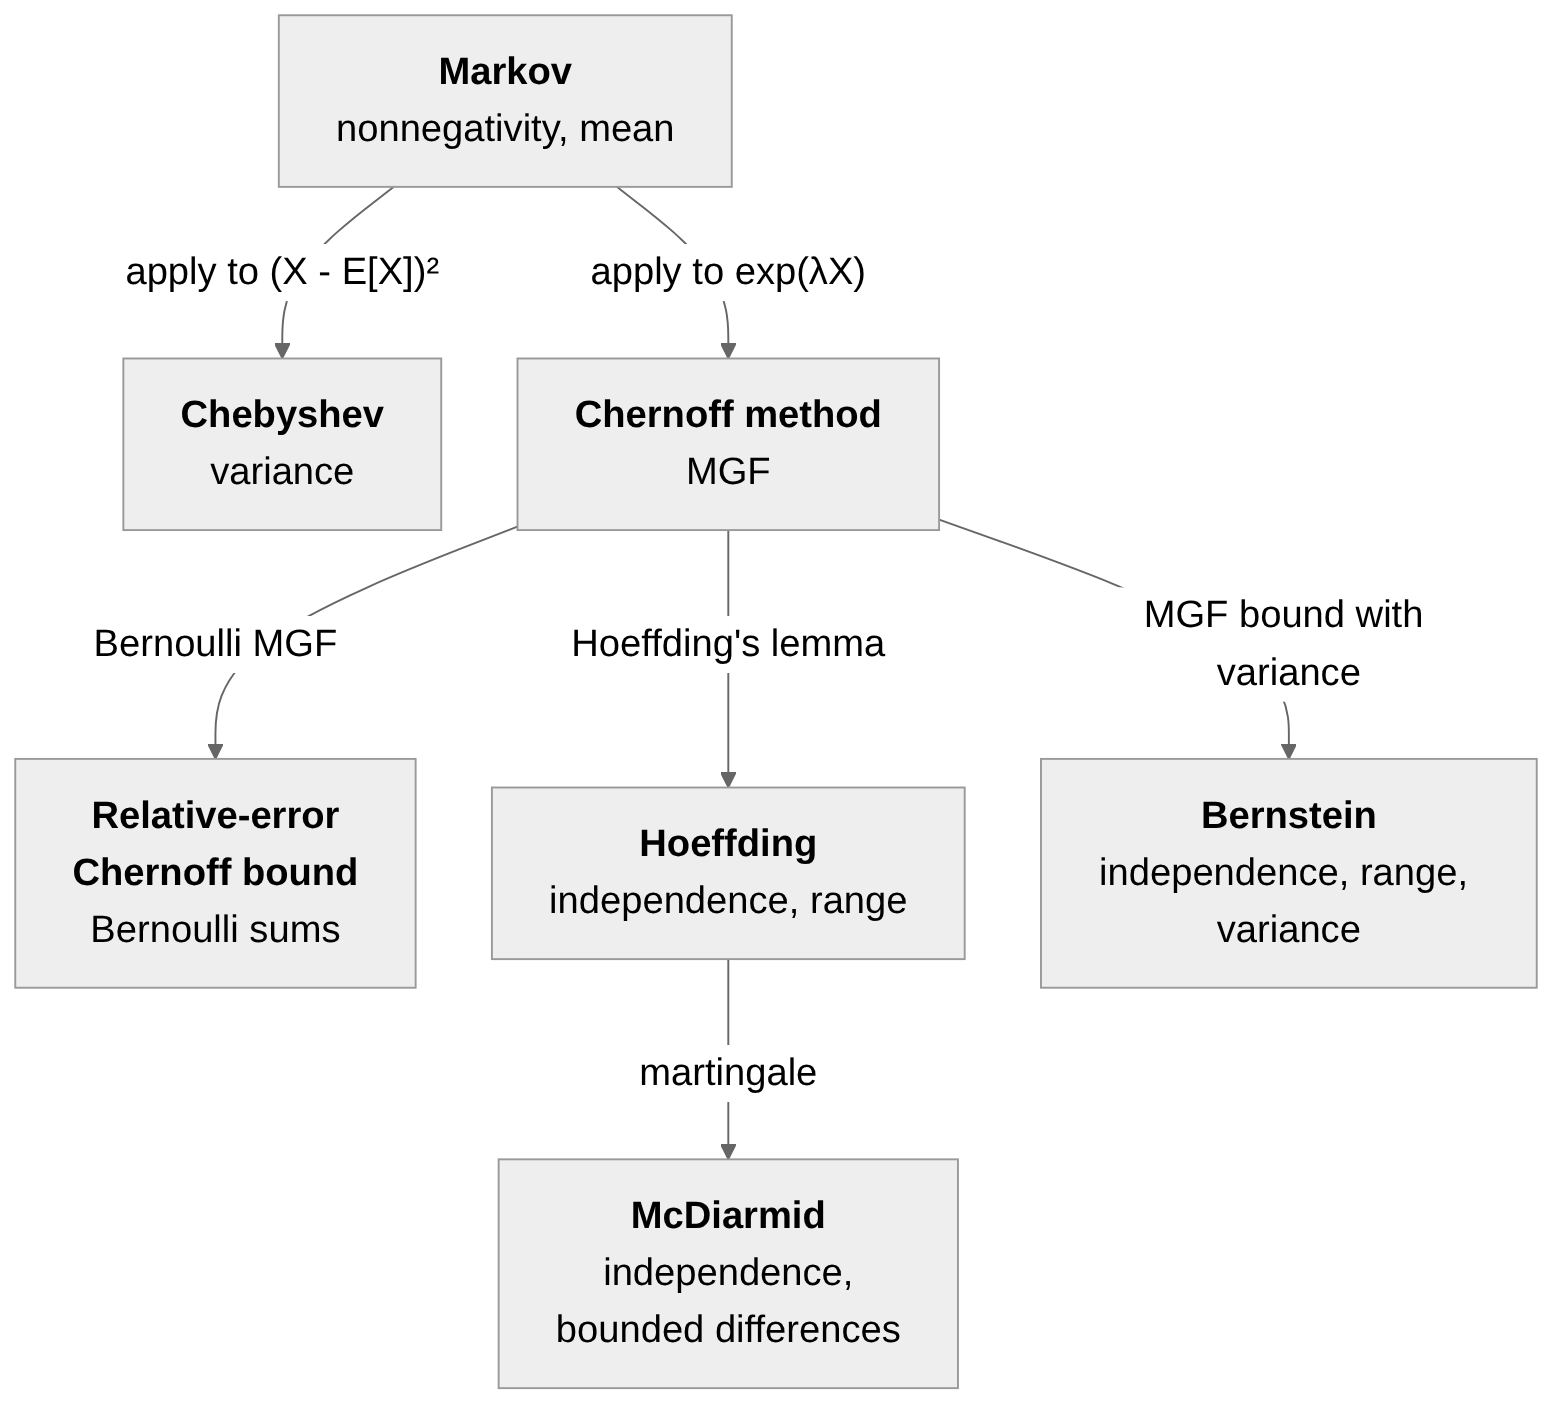
- Markov → Chebyshev: Applying Markov's inequality to the squared deviation bounds tail probabilities by the variance.
- Markov → Chernoff method → Hoeffding, Bernstein, McDiarmid: Applying Markov's inequality to an exponential function and bounding the MGF gives bounds that decrease exponentially. McDiarmid's inequality uses a martingale decomposition to extend these bounds to functions other than sums.
Every one of these inequalities answers the same question: how far can a quantity computed from finitely many samples deviate from its expectation? As the running example in Section 8 shows, which inequality gives the smallest bound depends on the available assumptions (variance, range, independence, and stability of the function) and on the conditions of the problem.
References
- Azuma, K. (1967). Weighted sums of certain dependent random variables. Tohoku Mathematical Journal, 19(3), 357–367.
- Bartlett, P. L., & Mendelson, S. (2002). Rademacher and Gaussian complexities: Risk bounds and structural results. Journal of Machine Learning Research, 3, 463–482.
- Boucheron, S., Lugosi, G., & Massart, P. (2013). Concentration Inequalities: A Nonasymptotic Theory of Independence. Oxford University Press.
- Chernoff, H. (1952). A measure of asymptotic efficiency for tests of a hypothesis based on the sum of observations. The Annals of Mathematical Statistics, 23(4), 493–507.
- Hoeffding, W. (1963). Probability inequalities for sums of bounded random variables. Journal of the American Statistical Association, 58(301), 13–30.
- McDiarmid, C. (1989). On the method of bounded differences. In Surveys in Combinatorics, 1989 (London Mathematical Society Lecture Note Series 141), 148–188. Cambridge University Press.
- Mitzenmacher, M., & Upfal, E. (2017). Probability and Computing: Randomization and Probabilistic Techniques in Algorithms and Data Analysis (2nd ed.). Cambridge University Press.
- Vershynin, R. (2018). High-Dimensional Probability: An Introduction with Applications in Data Science. Cambridge University Press.